
AWS CloudWatch Vs Nagios
Nagios is an open-source network monitoring software that monitors systems, networks, and infrastructure. Nagios is designed with the scalability and flexibility in mind. The main aim of Nagios is to monitor the status of network devices and their services and to notify the system administrators when server or network problem occurs. Nagios performs the status check through the use of external “plugins”, which are compiled executables or scripts that can be run from command line to check the status of hosts or services. Users can also create their own plugins to support any peculiar devices or services in their network. Nagios has proven popular among small businesses and also other users include Internet service providers (ISP’s), educational institutions, government agencies, manufacturing companies, and financial institutions.
Benefits:
Comprehensive Monitoring
It provides monitoring of all mission-critical infrastructure components including applications, services, operating systems, network protocols, and network infrastructure.
Proactive Planning
Trending add-ons and capacity add-ons allow the organizations to plan for infrastructure upgrades before outdated systems catch them. Scheduled downtime allows for alert suppression during infrastructure upgrades.
Reporting
It provides historical records of outages, notifications, and alert responses for future analysis.
Intelligent Scheduling
Parallel processing architecture provides quick detection of infrastructure outages and maximum utilization of hardware capabilities.
Route Detection
Intelligent detection of network outages ensures that IT staff can quickly locate the source of problem.
Limitations :
- Nagios makes no differentiation among different types of devices such as servers, routers, or switches.
- Nagios treats every device generically as host.
- Creating check dependencies is bit burdensome, as you have to refer checks via their service_description field. This means the user has to use either the description like ID or should duplicate the description in all places where the user wants to check.
- The web interface is mostly read-only.
- Nagios needs SSH access to monitor remote system internals.
AWS CloudWatch
Amazon CloudWatch is a monitoring service for AWS cloud resources and the applications which the user runs on AWS. CloudWatch enables real-time monitoring of AWS resources such as Amazon EC2 instances, Elastic Load Balancers, and Amazon RDS database instances. Users can access CloudWatch functions through an API, command line tools, AWS SDK (software development kit) or AWS Management Console. The CloudWatch interface provides the frequent statistics that can be viewed in a graph format.
Benefits:
Billing Alarm Metrics
The CloudWatch monitors the charges of AWS bill by sending e-mail alerts when charges exceed a defined threshold.
Limits
Cloud Watch can assign up to five actions per alarm. It can also create 5000 alarms per AWS account. Cloud Watch can also assign up to 10 dimensions per metric.
Monitoring Auto scaling
Auto scaling instances sends metrics to Cloud watch. It offers two kinds of monitoring, basic monitoring which gives aggregated data about each instance every 5 minutes and there is Detailed monitoring which sends metrics every minute.
SNS with Cloud Watch
SNS and Cloud Watch can be integrated to get metrics on each SNS topic. You can monitor the metrics using either the console, CLI, or programmatically using API. Email notifications can be set if specific thresholds are met for an Amazon SNS metric.
Log file monitoring
The Log files can be stored directly on the console.
Limitations :
loudWatch runs on the principle eventually consistent that means, not all the metrics will be available consistently and thus a user may miss some important events.
CloudWatch gives “out of box” metrics for a small subset of services. The user needs to use other softwares to monitor other metrics and then use the AWS API to publish the performance history to CloudWatch.
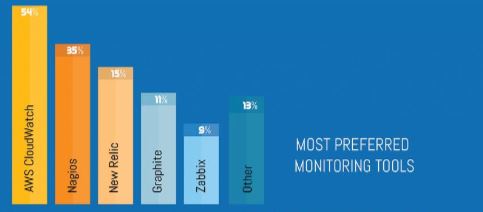
While conducting a survey among 235 employees in an AWS summit, the above diagram shows the poll outcome explaining that AWS CloudWatch and Nagios are the most preferred monitoring tools.